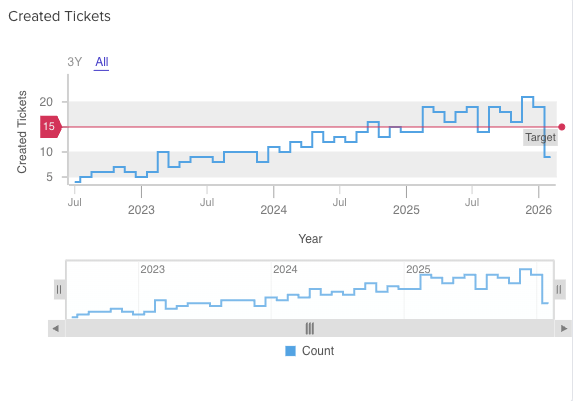
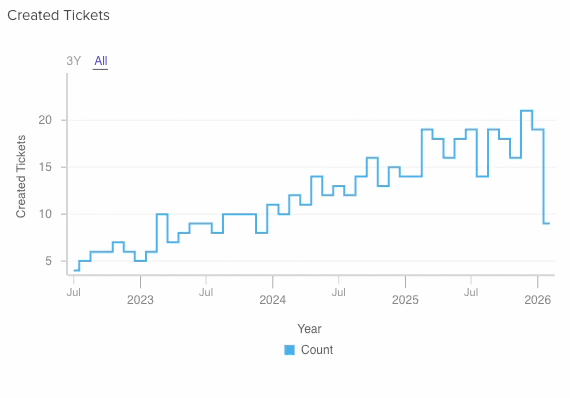
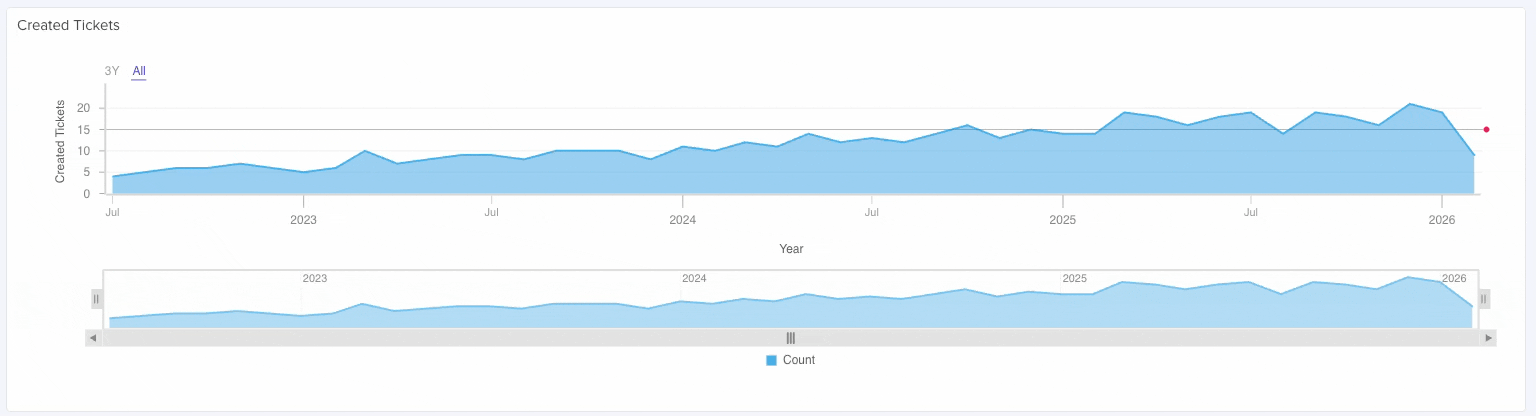
The Time Series Chart is designed to let you view large-record flows through specific sets of time. Useful for getting a clear scalable view and to help you detect trends.

Set Up
Select an app with a heavy record flow. We will be using the Tickets App, then add a Widget.
General
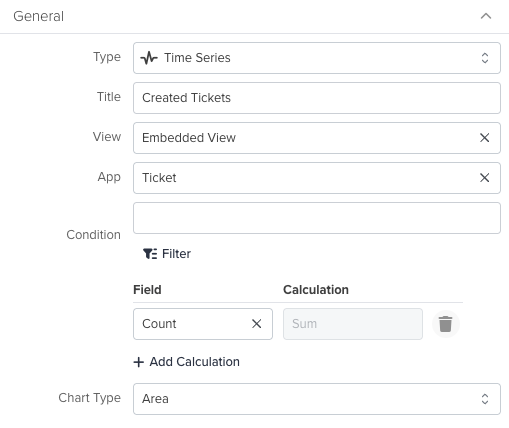
Type: Select Time Series.
Title: Write a custom title for your widget.
View: Is the view of the selected App containing the records to render.
App: The App you are currently in when creating the widget.
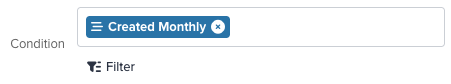
Condition: The main configuration for displaying your data. Click Filter, then go to the Group tab and select the Date Field you want for the widget to display the records.
Condition: The main configuration for displaying your data. Click Filter, then go to the Group tab and select the Date Field you want for the widget to display the records.
You will see the right-hand panel updating immediately after this.
Field: Here you can select how the chart treats the field you selected on the Filter.
Calculation: Sum only for this widget.
Chart Type: Change the appearance of your data on the widget.
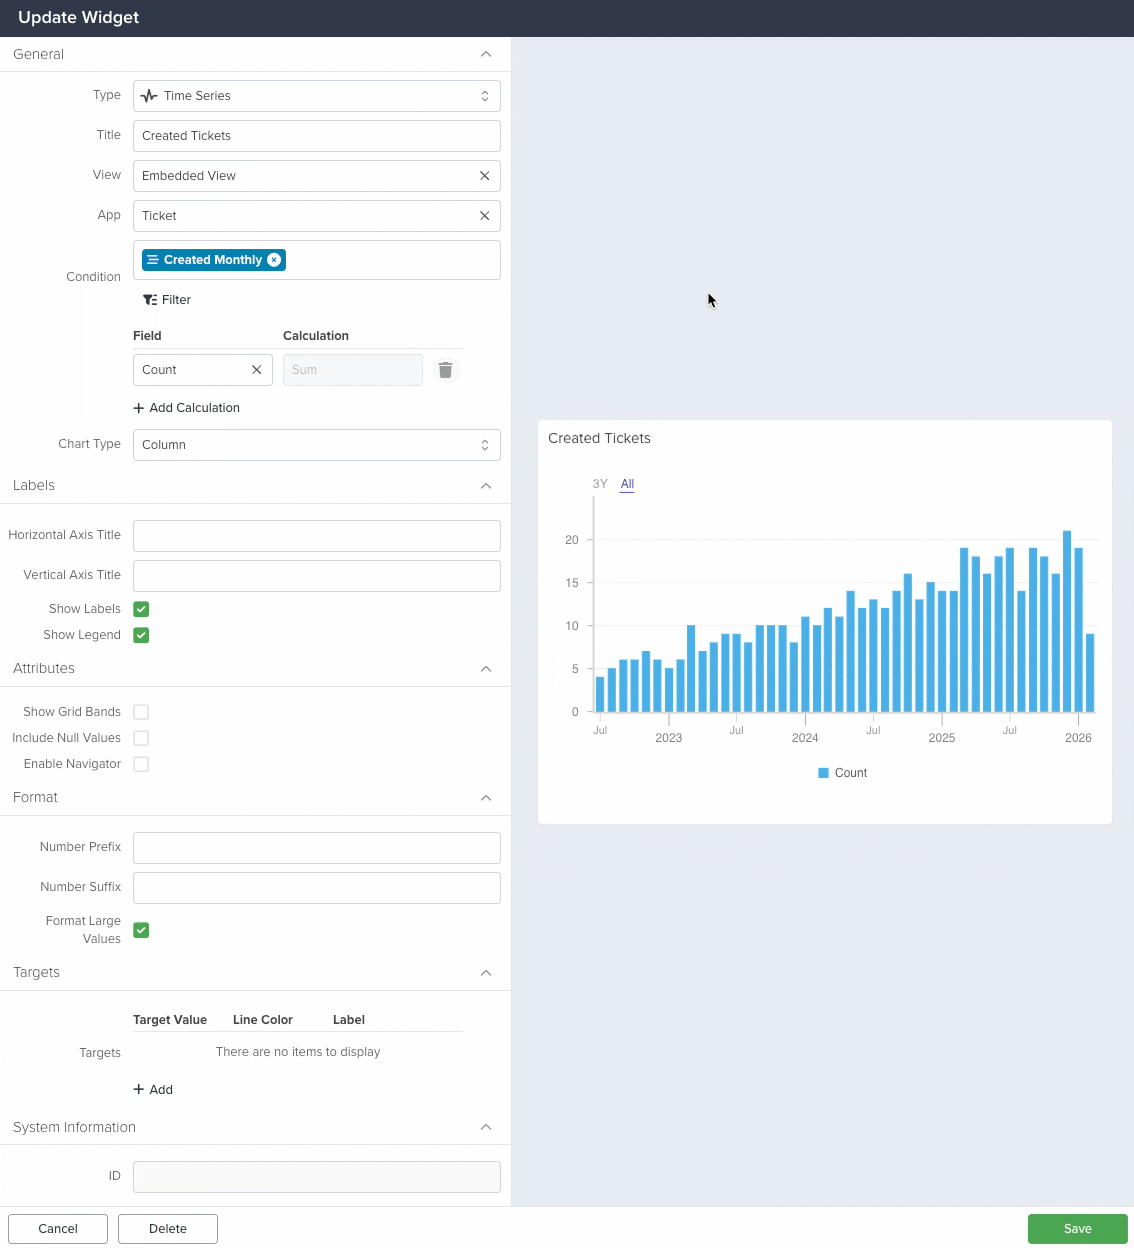
Labels
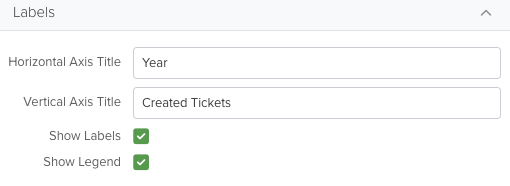
Horizontal Axis Title: Text displayed at the left side of the chart
Vertical Axis Title: Text displayed below the chart.
Show Labels: Click to show or hide the Horizontal and Vertical Axis Titles.
Show Legend: Click to show or hide the color legend at the bottom of the chart.

Attributes
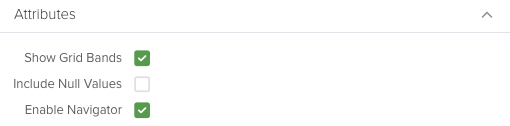
Show Grid Bands: Show or hide bands on top of the chart.
Include Null Values: Make the chart display null values too.
Enable Navigator: Show or hide the Navigator, a tool dedicated to zooming in or out of your chart.
Navigator
Use this to zoom in or out on your chart.
Format
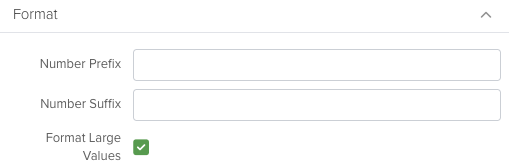
Number Prefix: Add any character before the number.
Number Suffix: Add any character after the number.
Format Large Values: If you have large numbers in your chart, this will change the format for a better visualization.
Targets
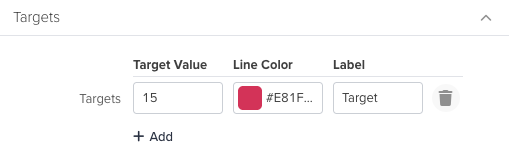
Click the +Add button
Target Value: Write a number for the chart to render a line across it.
Line Color: Apply a color for you to quickly identify the target.
Label: Text that will appear when hovering the target line.