Create Dashboards from your Saved Views to get all the information you need at a glance. Organize the content in the way that works best for you and export your reports as PDF files.
Edition Qualifier: The filter feature is available in all servis.ai Editions.
User Permissions: This feature is available to all users in servis.ai.
Navigate to Dashboards
From the Navigation Menu, go to Reporting > Dashboards.
Dashboards Page
From the Dashboards page you can view all of your existing Dashboards or create a new Dashboard.

Create a Dashboard
To create a new Dashboard, click the Add Dashboard button in the top left hand side of the Dashboards page.

The Add Dashboard form will appear.

Name
The Name field allows you to name the Dashboard.
The name of the Dashboard should be simple and informative, telling you what Dashboard details.
Accounts Dashboard is a good example of a name for a Dashboard.
This is a required field (*).
Share with Team
The Share with Team field allows you to specify whether the Dashboard is accessible only to you or if it can be accessed by your team. If you select the Share with Team box, two new fields will appear that allow you designate the access level team members have.

Read-only
If you select Read-only, all of your team members will be able to see the Dashboard, but they won’t be able to edit it.
Full Edit Access
If you select Full Edit Access, all of your team members will be able to edit the Dashboard.
Save
Click the Save button in the bottom left hand side of the Add Dashboard form to save the Dashboard. The Dashboard will appear on the Dashboards page.
Add Widgets
Once you have created your Dashboard, it is time to add the Widgets. Begin by opening the Dashboard and selecting the Dashlet button at the top right of the page.
Note: Widgets may make use of your Saved Views. As such, you may find it easier to create a Saved View before creating a Widget. To learn more about creating Saved Views, check out our article, Views.

The Add Widget form will appear. The contents of the Add Widget form will vary depending on the Widget you have selected from the Widget menu at the top.
Note: As you create the Widget, the Display Window will populate with a visualization of the Widget.
Choose Your Widget Type
When creating a Dashboard in servis.ai there are many different Widgets to choose from. To learn more about the different types of widgets available, check out the articles in our Widget Library.
Note: servis.ai can render up to 100 Widgets per Dashboard or View.
General Widget Settings
Regardless of Widget type, you will need to set the following settings for all Widgets.
Title
The Title field allows you to name the Widget.
The name of the Widget should be simple and informative, telling you what Widget details.
Accounts by Industry is a good example of a name for a Widget.
View
The View field allows you to select the view you want to use as the base for the Widget. You can use a Saved View or select Embedded View and create a new view for this widget. To learn more about creating Saved Views, check out our article, Views.
App, Condition, Filter
These fields are used to create your own Embedded View. To learn more about creating Views, check out our article, Views.
Field
Field allows you to designate a field to use for the Widget’s data. Options available are based on the App used when creating the Widget.
Labels
The Labels section of the Widget Settings allows you to label the various elements of the Widget. Options for what you can label will vary based on the type of Widget you are creating.
For example, when creating a Bar Chart Widget, you can label the vertical and horizontal axes. You can also decide whether these labels are visible or not.
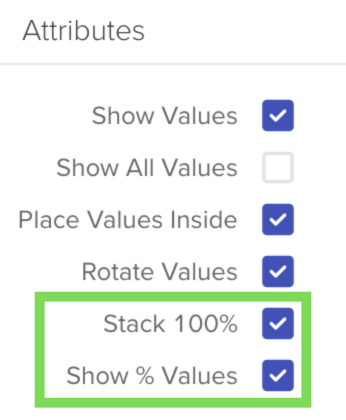
Attributes
The Attributes section of the Widgets Settings allows you to designate how elements of the data will be displayed. Options will vary based on the type of Widget you are creating.
For example, when creating a Bar Chart Widget you can choose whether or not to display the exact value of each bar in the Widget.
Format
The Format section of the Widget Settings allows you to designate how the information in the widget will be displayed.
Show Top N
The Show Top N setting controls how many records are displayed within a widget.
- Enter a number to define how many records you want to show. For example, entering 5 will display the top 5 records.
- The default value is 50. If you leave this field empty or set it to 0, the widget will show the top 50 records.
- The maximum limit is 100. If a higher number is entered, only the first 100 records will be shown.
Default Format
The Default Format field allows you to override the default format of the data being displayed in the Widget.
Note: Default Format is enabled by default.
Number Prefix N
The Number Prefix field allows you to place a prefix in front of the numbers in the Widget. Common prefixes include $ or #.
Format Large Values
The Format Large Values field allows you to apply a format to simplify large values. For example, you can change 14,000,000 to 14M.
Targets
The Targets section in Widget Settings lets you add visual indicators for targets tied to specific metrics.
For instance, if you’re using a bar chart to show how many leads each sales rep converted into opportunities, you can also display a quarterly target line. This makes it easy to compare actual performance against set goals.

Fullscreen
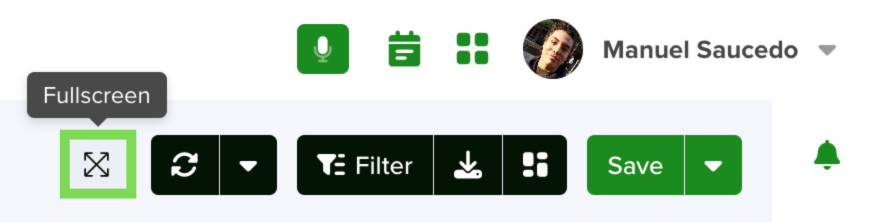
The Full Screen button lets you expand your entire dashboard to occupy the full screen, providing a clear and immersive view of all your widgets. In this mode, you can:
- Resize widgets to better fit your layout preferences
- Drag and drop widgets to rearrange their placement for a customized display
Refresh
Note: This feature is available exclusively to users with Admin permissions.
The Refresh option turns your dashboard into a live, auto-updating view. You can either manually refresh it or set an automatic refresh interval.

Here’s how it works:
- Locate the Refreshbutton at the top-right of the dashboard.
- Click the button to manually refresh the entire page and fetch the latest data from the app.
- Hover over the dropdownnext to it to choose an automatic refresh interval:
- Off – Disables automatic refresh.
- 1 min – Refreshes the dashboard every 1 minute.
- 2 min – Refreshes every 2 minutes.
- 5 min – Refreshes every 5 minutes.

This keeps your dashboard up-to-date with the most recent changes without needing to reload it manually.
Note: The automatic refresh timer continues to run as long as you remain on the dashboard.
Filters for the Entire Dashboard
You can create filters that will apply to all of the widgets on your dashboard. This is useful in situations where you want to look at specific sections of your data across all of your widgets.
Click on the Filter button at the top of the Dashboards page. To learn more about filters, check out our article, Filter, Sort & More.

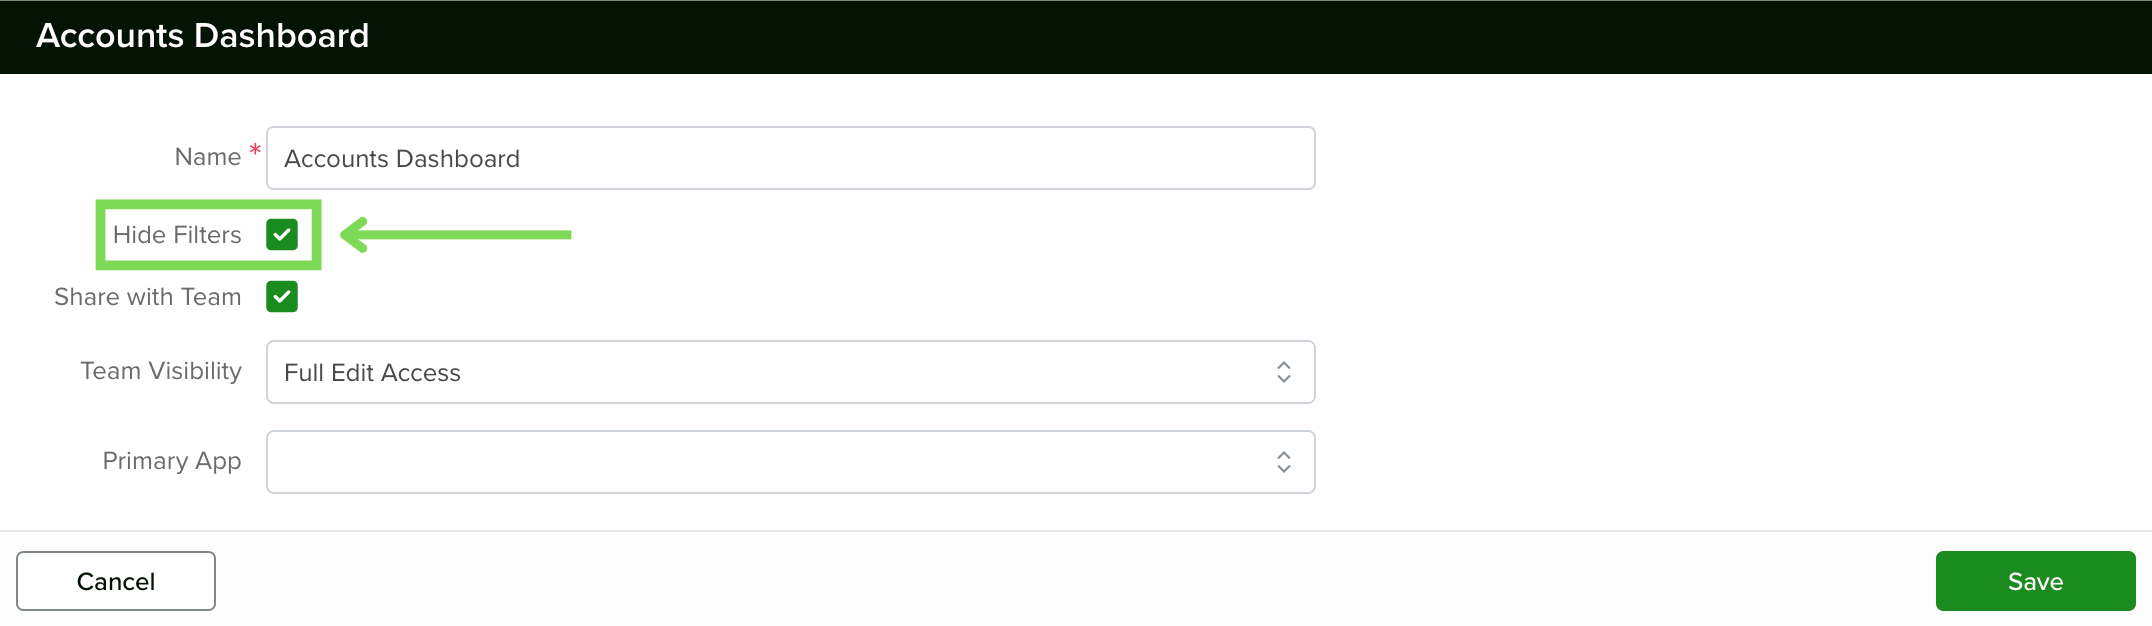
Hide Filters
Hide filter pills on your dashboard to keep the view clean—your filters stay applied in the background.
Organizing Your Widgets
- To customize your layout, simply drag and drop widgets where you want them. Everything else will adjust automatically.
- You can also resize widgets using the tool in the bottom-right corner of each view.
In the top right corner of each widget, hover over the three dots to get more options.

Edit
Change the configuration of your widget, including the type and view.
Duplicate
Create an exact copy of your widget
Export as CSV
Export your widget in CSV format.
Print to PDF or Schedule Report
Click the Export button in the top right hand side of the Dashboard details page to Print to PDF or Schedule Report.

Print to PDF
When you select Print to PDF, you will receive a notification when the Dashboard is ready to print. Click on the notification and the accompanying URL to initialize the PDF download.

Schedule Report
You can schedule a report based on your dashboard. When you select Schedule Report, the Add Scheduled Report form will appear. Name the report, decide whether or not to share the report via email (if so, with whom), and set the time and frequency of the report.
To learn more about scheduling reports, check out our article, Scheduled Reports.

For more information about Dashboards, please visit the following tutorial:
Manage Dashboards