The Gantt View is used to track projects or tasks over a period of time in a bar chart–style format.
User Permissions: No special permissions are required to use the Gantt View.
Create a Gantt View
You can create a Gantt View in any App that includes both a Start Date field and an End Date field, including custom Apps.
Navigate to the Gantt Tab
To access the Gantt tab, navigate to an existing App view and select the Filter button in the top right-hand side of the page.
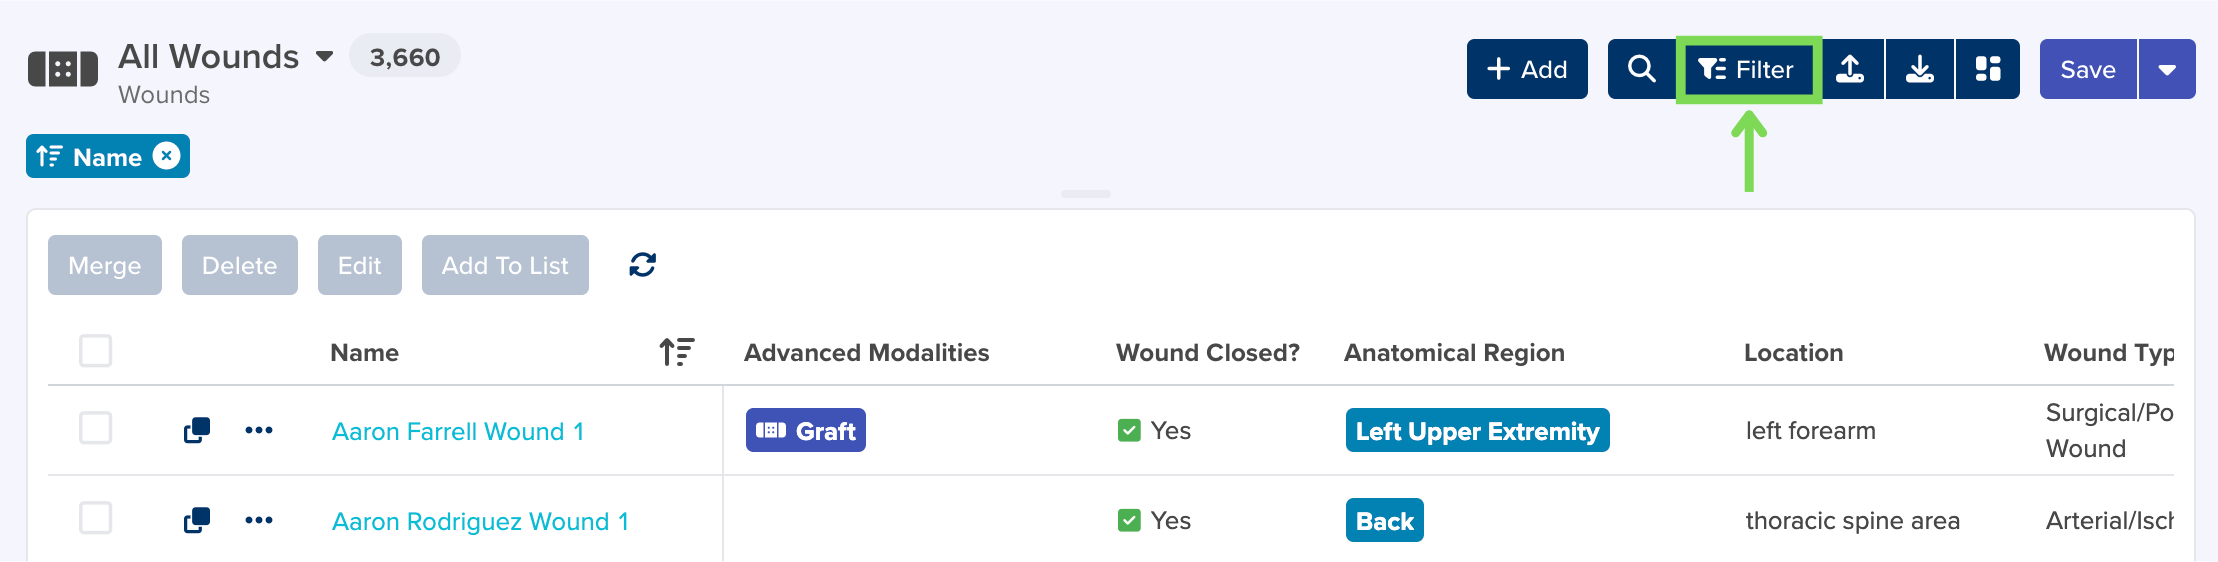
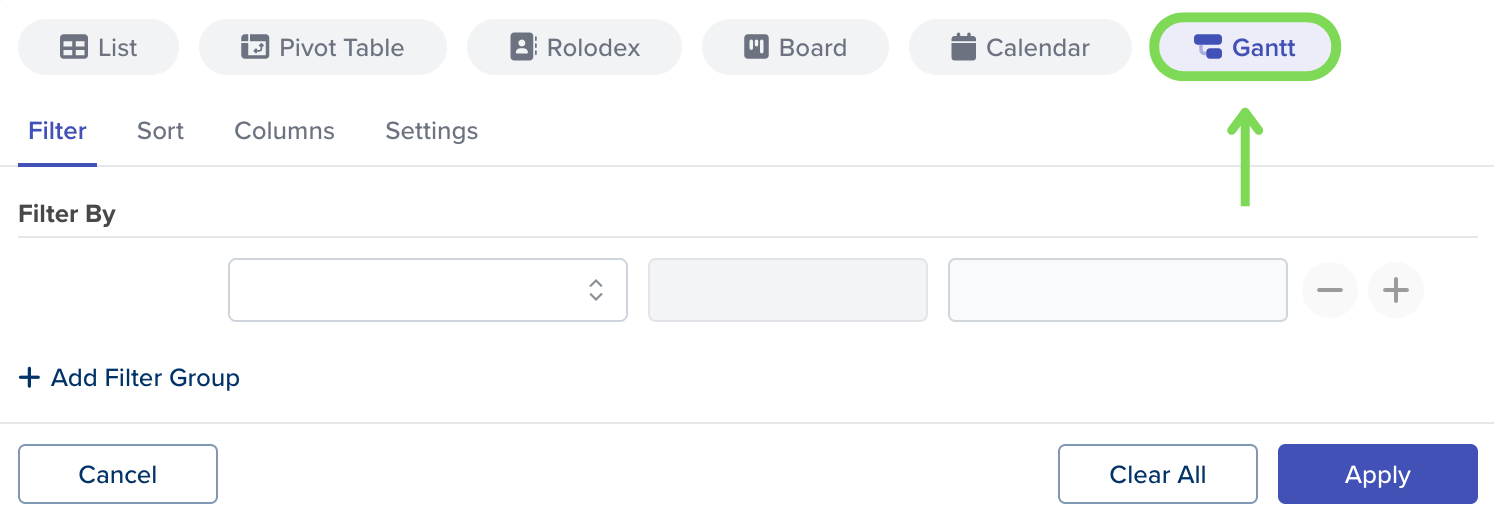
The Filter, Sort & More window will appear. Select the GANTT tab in the top right-hand side of the window.
Configure Gantt Settings
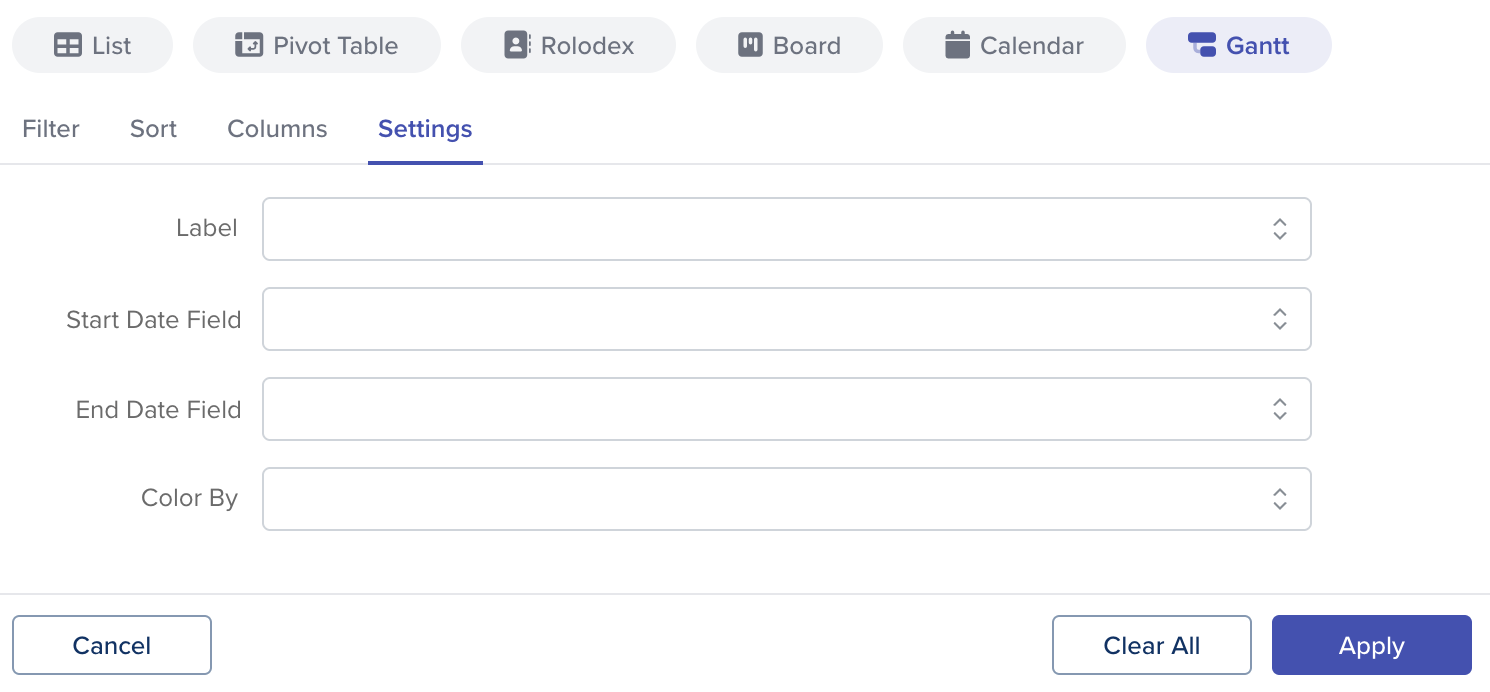
From the Gantt tab, select the Settings tab. From here, you can configure your Gantt View settings.
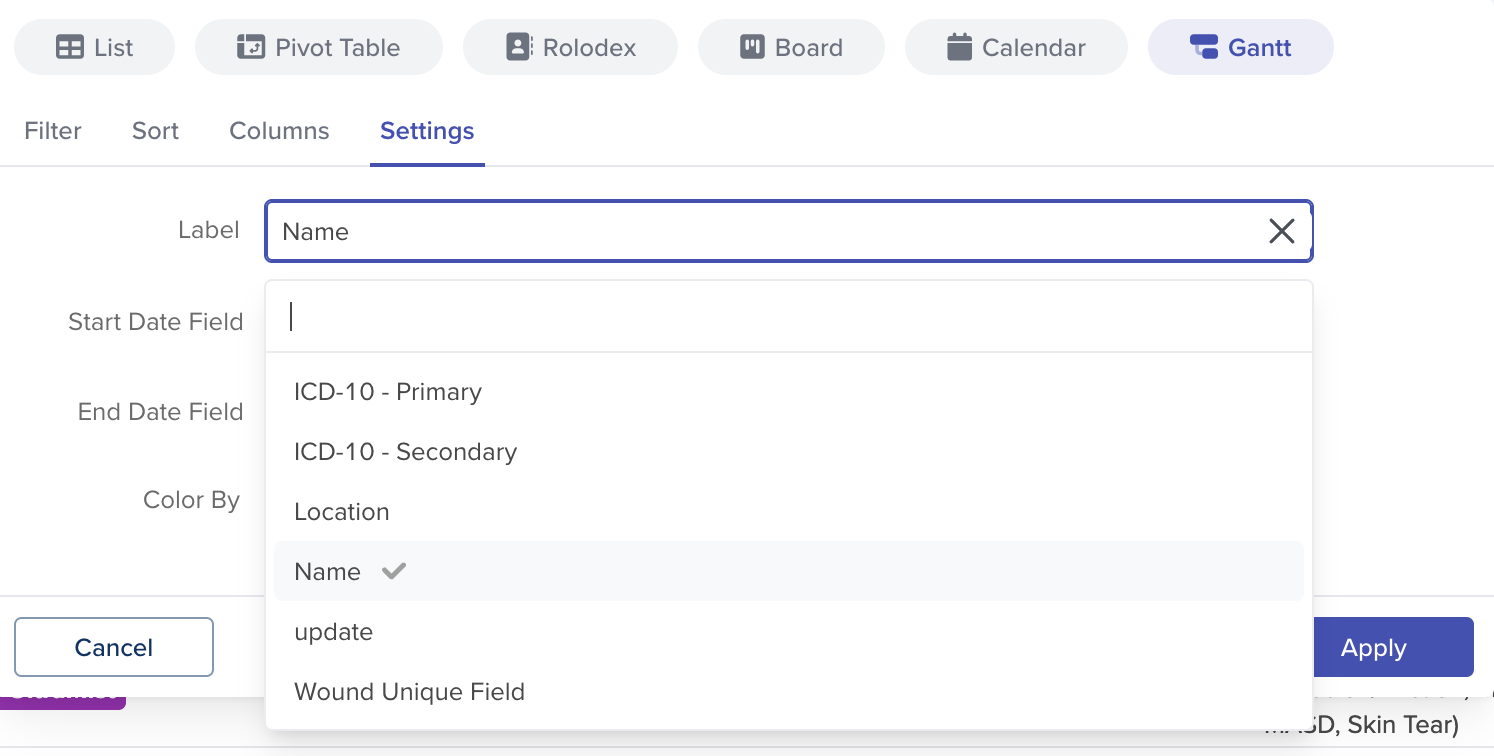
Label
The Label field allows you to choose which field in the App will be used to label the bars in your Gantt View. The available options appear in a dropdown list containing all relevant fields in the App.
For example, if you are creating a Gantt View to track projects in the Projects App, you can use the project Name or Description field as the label.
Start Date Field / End Date Field
The Gantt View tracks progress over time and requires both a start date and an end date. The Start Date Field and End Date Field allow you to select which fields will be used to populate these values. Available options will appear in a dropdown menu containing all fields in the App.
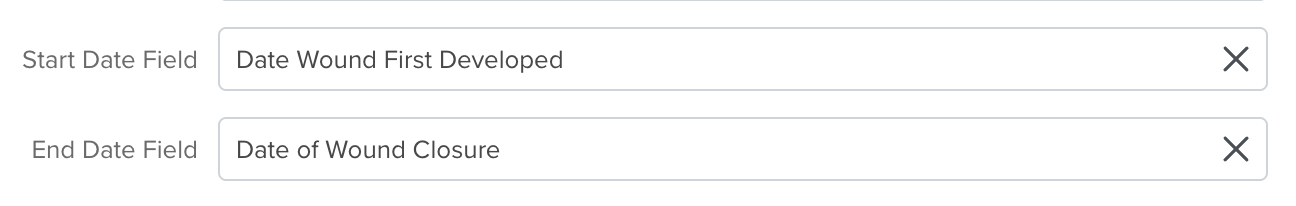
Note: The selected fields must be Date fields. See our Date Field article to learn more.
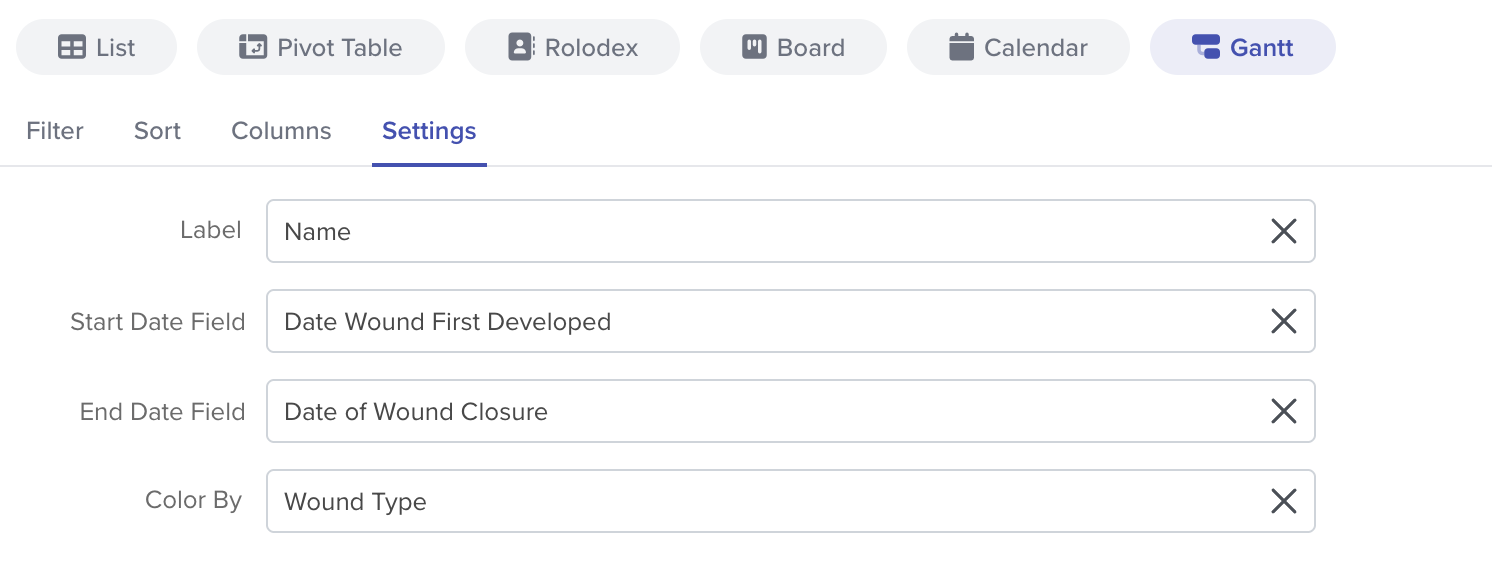
Color By
The Color By field allows you to define how Gantt elements are color-coded. You can choose to color code by Stage, Priority, Status, Owner, and more. Options are displayed in a dropdown list with all relevant fields.
Once you select an option in the Color By field, a new section will appear in the Settings tab.
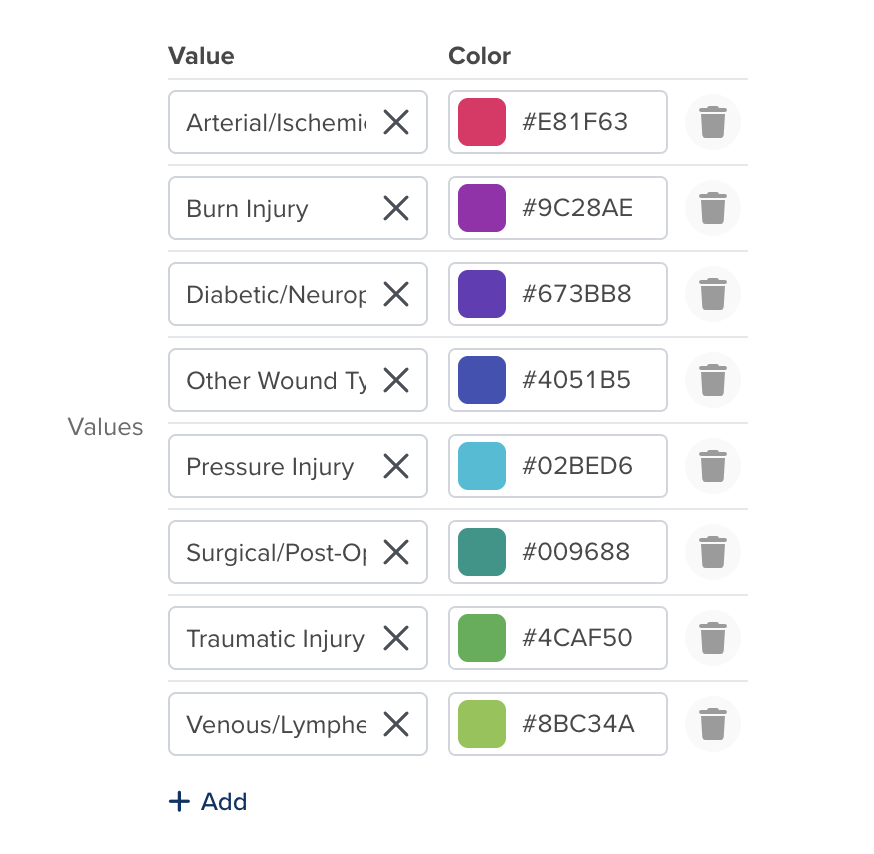
Here, you can assign colors to your Gantt elements. Click the + Add button in the bottom left corner.
The Value and Color fields will appear, allowing you to assign colors to each value. The available options depend on the selection in the Color By field.
For example, if you select Project Stage, you can assign a color to each stage. Click + Add again to add additional rows.
Filter, Sort, and Columns
From the Gantt tab, you can configure your Filter, Sort, and Column settings. See our Filter, Sort & More article to learn more.
Editing a Gantt View
You can edit values directly within the Gantt View. For example, double-click a value in one of the columns to edit it.
You can also interact with the chart bars. Hover over a bar to view details. Click and drag to adjust the Start Date or End Date.
You can zoom in and out of the timeline using the + and − buttons at the top of the chart: